R 线图
线图
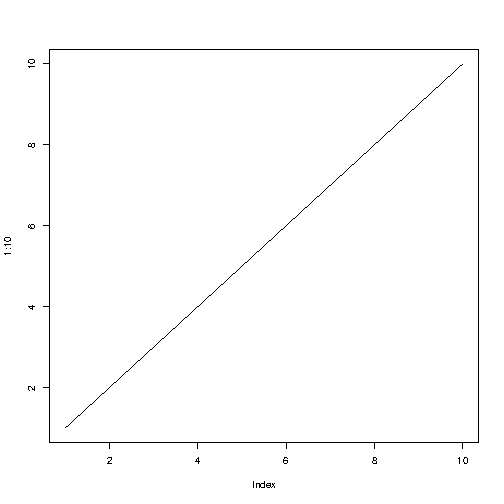
线图有一条线连接图中的所有点。
要创建一条线,请使用 plot() 函数,并将 type 参数的值设置为 "l":
实例
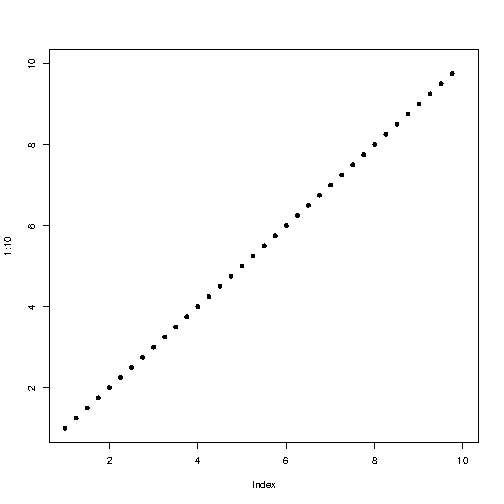
plot(1:10, type="l")
结果:
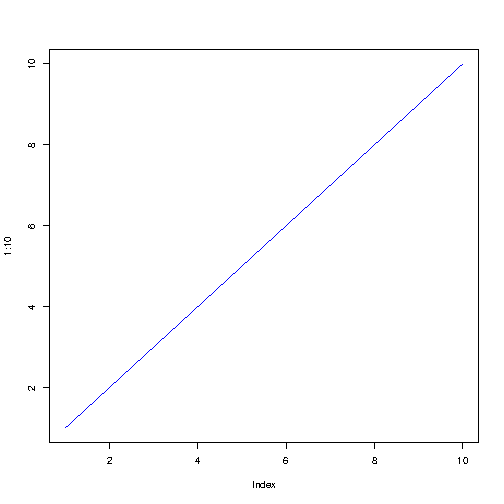
线条颜色
线条颜色默认为黑色。要更改颜色,请使用 col 参数:
实例
plot(1:10, type="l", col="blue")
结果:
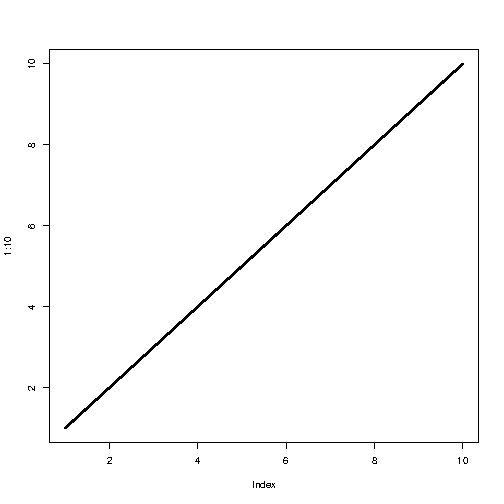
线条宽度
要更改线条的宽度,请使用 lwd 参数(1 是默认值,0.5 表示缩小 50%,2 表示增大 100%):
实例
plot(1:10, type="l", lwd=2)
结果:
线条样式
线条默认为实线。使用 lty 参数并为其指定 0 到 6 之间的值来指定线条格式。
例如,lty=3 将显示虚线而不是实线:
实例
plot(1:10, type="l", lwd=5, lty=3)
结果:
lty 的可用参数值:
0移除线条1显示实线2显示虚线3显示点线4显示“点虚线”5显示“长虚线”6显示“双虚线”
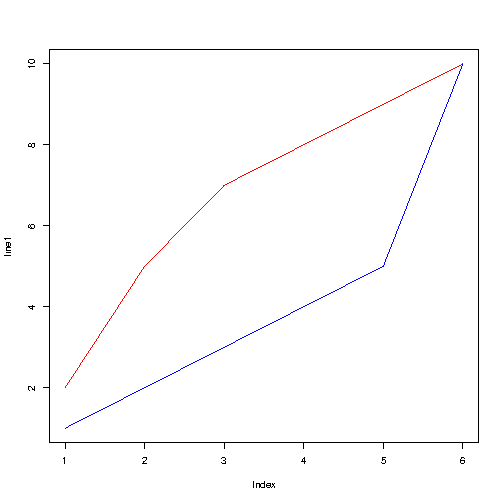
多条线
若要在图中显示多条线,请将 plot() 函数与 lines() 函数结合使用:
实例
line1 <- c(1,2,3,4,5,10)
line2 <- c(2,5,7,8,9,10)

plot(line1, type = "l", col = "blue")
lines(line2, type="l", col = "red")
结果: